


SiDiary for iPhone - Manual - Trend
(Please click here to download the manual in PDF format.)Content:
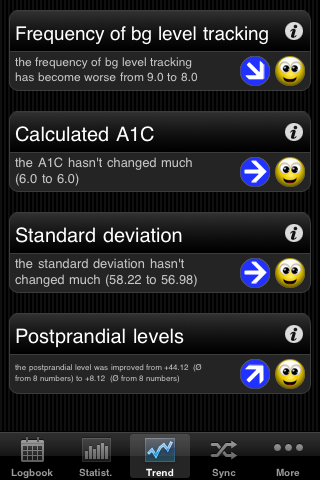 |
The trend analysis compares two time ranges to see how things are changing. The things we look at are: How often you track blood sugar levels, the average blood sugar level over time, how much the blood sugar level can vary from the average, and the blood sugar level after eating a meal.
If you select '1 Week' in the settings for the analysis, then the last 7 days will be compared with the previous 7 days. |
The set of criteria for the level:
| ... | Excellent | Good | Satisfactory |
| Frequency: | More than 3 | equal to 3 | less than 3 |
| Calculated A1C: | less than 6,5% | less than 7,5% | less than 9% |
| Standard deviation: | less than 60 mg/dl (3,3 mmol/l) | less than 70 mg/dl (3,9 mmol/l) | less than 80 mg/dl (4,4 mmol/l) |
| Postprandial level: | less than 60 mg/dl (3,3 mmol/l) | less than 80 mg/dl (4,4 mmol/l) | less than 100 mg/dl (5,5 mmol/l) |
A blood glucose value will be calculated as 'postprandial' if the measurement comes 60-120 minutes after an entry for carbohydrates.
In the settings for 'Trends' (via the i-symbol at the top) you can select which time ranges should be calculated and which parts of a day you want to analyze for the postprandial levels.The parts of day are:
- After breakfast: 10:00 - 11:59 (10:00am - 11:59am)
- After lunch: 15:00 - 16:59 (03:00pm - 04:59pm)
- After dinner: 20:00 - 03:59 (08:00pm - 03:59am)


